
Today is July 22, 2026, and the DFS Dashboard football projections are live for the season ahead. Before you read a single number, it helps to understand what these projections are and, just as important, what they are not. They are not my hot takes. They are not a gut feel about which rookie is going to pop. They are the output of a process that starts with the sharpest data in the market and ends with a probability for every player on the board.
Here is what that board is telling me on July 22.
The real analyst is the data
A little about how I come at this. I am a senior finance executive and a data analytics specialist, and I bring the same discipline of risk management and expected value that runs corporate finance to fantasy football. I have been a high stakes fantasy player since 1992 and an expert horse racing handicapper since 1982, so I have spent decades turning data into an edge in places where real money is on the line.
That background shapes one core belief: the real analyst here is the data. My job is to be the conduit. I listen to what the numbers say, translate the signal into clear and actionable reads, and get my own ego and guesswork out of the way. When the model and my gut disagree, the model wins.
Where the numbers come from
Every projection you see begins with real time sportsbook player prop odds. That is a deliberate choice. The player prop market is the most efficient and liquid market in the world for predicting player performance, which means I start from the same numbers the books use to set their lines rather than from an opinion.
From there, the process runs in three steps.
- Simulate. I run more than 100,000 Monte Carlo simulations built on those odds. Every simulation plays out a different version of the season, so the output captures the full range of what could happen instead of a single guess.
- Convert to probabilities. Those simulations become probabilities, not point estimates. Every player ends up with a unique probability curve. That is why each name carries a median outcome, a 75th percentile outcome, a 90th percentile outcome, and real odds of finishing top three, top five, or top 12 at the position.
- Frame the risk. Because every number is a probability, you always know the risk behind it. A safe floor and a league winning ceiling look very different on a probability curve, even when two players share the same average.
The projections refresh every 15 minutes and pull from multiple sportsbooks including FanDuel, DraftKings, BetMGM, and Caesars. Injuries, depth chart moves, and player news flow into the model around the clock.
Now to the fun part.
What the July 22 board says at quarterback
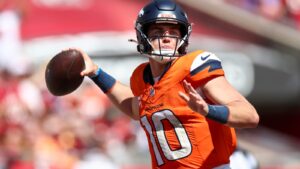
Josh Allen sits at the top of the quarterback board with a median of 355 points and a 90th percentile outcome of 438. The model gives him a 94.9 percent chance to finish as a top 12 quarterback and better than a 60 percent chance to land in the top three. He is the clear number one, and he is the earliest quarterback off the board.
Here is the more useful story, though. Right behind Allen the data sees a deep wall of quarterbacks who project near the top of the entire player pool yet come at a fraction of the draft cost. Drake Maye carries a 311 median. Jalen Hurts sits at 307, Jayden Daniels at 304, and Lamar Jackson at 298, and all of them are being drafted well after the early rounds. If you want a top six quarterback without paying a premium, the July 22 numbers say you can wait and still get one.
Running back is top heavy
The running back position separates fast. Jahmyr Gibbs leads everyone with a 320 median and a 442 ceiling, the highest ceiling of any player at any position. Bijan Robinson follows at 310 and Christian McCaffrey at 291. All three carry better than a 97 percent chance to finish as a top 12 back.
After that trio the math drops off. Ashton Jeanty and De’Von Achane headline the next group in the 236 to 239 range, a meaningful gap from the top three. In a format that rewards backfield certainty, that shape is the whole argument for spending early capital at the position.
Wide receiver depth and a couple of tight end kings
At receiver the model likes a tight cluster at the top. Ja’Marr Chase leads the group with a 289 median and the best top five odds among wideouts. Puka Nacua, CeeDee Lamb, Rashee Rice, Justin Jefferson, and Drake London round out a deep early tier, which is exactly why receiver is the position to accumulate rather than force.
Tight end is the opposite story. It is not a position of depth this year. It is a position of two. Trey McBride projects a 229 median with a 79 percent chance to finish top three at the position, and Brock Bowers sits right behind at 219 with 72 percent top three odds. After those two the board falls off a cliff to Colston Loveland and Tyler Warren in the low 170s. If one of the top two falls into range, the weekly edge is real.
Where the model disagrees with the market
The most valuable thing a probability model does is tell you where the crowd is wrong in both directions.
On the value side, the story is quarterbacks. Patrick Mahomes, Jared Goff, Matthew Stafford, and Justin Herbert all project for 273 or more median points while going outside the top 95 picks. The market is treating a deep, safe position as an afterthought.
On the caution side, the model is cooler than the room on a handful of early running backs. It sees Chase Brown, Omarion Hampton, and Kenneth Walker III coming off the board earlier than their simulated point totals justify. That does not make them bad players. It means the price is ahead of the probability, and price is where drafts are won and lost.
Probabilities, not predictions
I want to be clear about what these numbers are. They are not a promise that Gibbs finishes as the RB1 or that Allen wins you a title. They are the odds, built from the sharpest market data available and stress tested across more than 100,000 simulated seasons. My job is to read them honestly and hand them to you without spin.
The board will look a little different tomorrow, because it refreshes every 15 minutes as the market moves and the news breaks. But the discipline behind it will not change. No bias. No gimmicks. Just probabilities.
The full 2026 projections are live now on DFS Dashboard. Come see what the data says about your team.